Oct 27, 2016

ChainLadder version 0.2.3 available on CRAN

ChainLadder is an R package for actuarial analysis of General / Property & Casualty insurance reserves. Version 0.2.3 on CRAN is is the first update in about a year. For the most part, the new version expands upon existing capabilities, as illustrated in the News vignette. Two of the most important are

  • the rownames (origin period) of a Triangle need no longer be numeric -- for example, accident years may be labeled with the beginning date of the period
  • the exposures of a glmReserve analysis may use names to match with origin period
Comments and contributors (!) are always welcome. Please refer to the package's repository.

Oct 16, 2016

October 2016 BARUG Meeting

The October meeting of the San Francisco Bay Area R User Group held at Santa Clara University consisted of socializing, an intro, and three speakers. In the intro, host representative Sanjiv Das highlighted the curriculum and advisory board of the school's new MS in Business Analytics program. The first speaker, yours truly, reenacted Sara Silverstein's Benford's Law post using R and insurance industry data (see previous posts in this blog). In light of the yahoo email scandal that broke that same day, it was posed to attendees whether a similar "law" might be found to discriminate between harmless and harmful emails without regard to message content. The last comment from the audience seemed to capture the evening's temperament: "Snooping is snooping!"

The other two timely talks dealt with election forecasting.

Mac Roach previewed a new online app from Alteryx to predict U.S. election results at the neighborhood level. Equally interesting was Mac's countrywide display, which was the first time I had seen graphical evidence of the increasing polarity of the American electorate, a disturbing trend IMO.

The last speaker, Pete Mohanty, spoke about presidential forecasting using bigKRLS. I was struck by the existence of a closed form solution to the problem. Pete's slides can be found here.

For a brief summary of the meeting, see BARUG's Meetup site.

Sep 8, 2016

Benford's Law in R (cont.): Actual Data

This is the second post based on Sara Silverstein's blog on Benford’s Law. Previously we duplicated the comparison of the proportion of first digits from a series of randomly generated numbers, and successive arithmetic operations on those numbers, and saw that the the more complicated the operation, the closer the conformance.

In this post we investigate the conformance with actual data, similar to Ms. Silverstein's investigation of "all the values from Apple's financials for every quarter over the past ten years."

Four different types of financial documents from property/casualty insurance were investigated:

1. An exhibit of estimated ultimate loss using various actuarial methods, and related calculated values
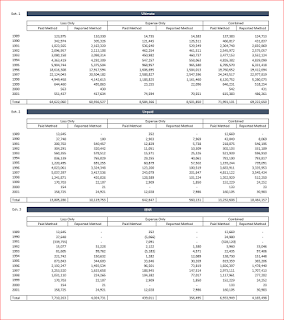
Exhibits.pdf
This exhibit includes financial values as well as some non-financial numbers, such as rows labeled with years, which could skew the results.

2. A Massachusetts insurance company rate filing 

In addition to many financial values, rate filings include much text and many numbers that are non-financial in nature.

3. An insurance company annual statement from 2009

Annual statements (aka, the Yellow Book) include many, many, many, many, many, many financial values.

4.  Schedule P data compiled by the Casualty Actuarial Society

Schedule P for six different lines of business for all U.S. property casualty insurers can be found at this link. The six files were combined into a single document. To isolate the investigation to purely financial numbers sans labels, company codes, and the like, the columns investigated are "IncurLoss_", "CumPaidLoss_", and "BulkLoss_".

Here are the results. The number of non-zero numbers in each document is indicated on the plot.


The Schedule P data is the most purely-financial in nature, and its plot in black matches Benford's Law almost exactly. Perhaps surprising, the Exhibits document is also quite close even though it holds the least number of observations. Perhaps a better job of pulling purely financial numbers out of the Rate Filing and the Annual Statement would improve their conformance.

Appendix


For reading PDF documents into R as text strings, I used the readPDF function in the tm package. Look at this link to learn how to download the binary files that make readPDF work easily, and the suggestion of where to store them for expediency.

To divide strings of characters into individual "words", I used 'scan' in base R. See this link.

For parsing numbers, in all their various forms with commas, decimal points, etc., I used the parse_number function in the readr package.

sessionInfo()


R version 3.3.1 (2016-06-21)
Platform: x86_64-w64-mingw32/x64 (64-bit)
Running under: Windows >= 8 x64 (build 9200)

locale:
[1] LC_COLLATE=English_United States.1252 LC_CTYPE=English_United States.1252
[3] LC_MONETARY=English_United States.1252 LC_NUMERIC=C
[5] LC_TIME=English_United States.1252

attached base packages:
[1] stats graphics grDevices utils datasets methods base

other attached packages:
[1] readr_1.0.0 tm_0.6-2 NLP_0.1-9

loaded via a namespace (and not attached):
[1] assertthat_0.1 rsconnect_0.4.3 parallel_3.3.1 tools_3.3.1 tibble_1.2
[6] Rcpp_0.12.5 slam_0.1-38


Aug 30, 2016

Benford's Law Graphed in R

Using R to replicate Sara Silverstein's post at BusinessInsider.com


A first-year student near and dear to my heart at the Kellogg School of Management thought I would be interested in this Business Insider story by Sara Silverstein on Benford’s Law. After sitting through the requisite ad, I became engrossed in Ms. Silverstein’s talk about what that law theoretically is and how it can be applied in financial forensics.

I thought I would try duplicating the demonstration in R.1 This gave me a chance to compare and contrast the generation of combined bar- and line-plots using base R and ggplot2. It also gave me an opportunity to learn how to post RMarkdown output to blogger.

Using base R

Define the Benford Law function using log base 10 and plot the predicted values.
benlaw <- function(d) log10(1 + 1 / d)
digits <- 1:9
baseBarplot <- barplot(benlaw(digits), names.arg = digits, xlab = "First Digit", 
                       ylim = c(0, .35))
Remarks:
  • That was easy!

Aug 11, 2016

Forking, Cloning, and Pull Requests with Github Desktop

This is the best explanation I've found of how to collaborate on someone else's repository. Bonus! it's a video:

Jul 31, 2016

A Diversified R in Insurance Conference

I visited London this month for the first time in many years, having been honored to participate in the fourth annual R in Insurance conference held at the Cass Business School. Mired in the deep rooted polarity of the current American presidential election, this traveler was refreshed and uplifted by London's surprising and multi-faceted diversity. The conference program organized by Markus Gesmann and Andreas Tsanakas was similarly multi-faceted and equally enjoyable. See highlights in Markus' Notes from the Conference and this amateur's images below.

In addition to the conference, I had the pleasure of meeting up with old friends and making new ones.

Apr 1, 2016

R Tools for Visual Studio (RTVS) now available: good news for MS-only shops

Microsoft informs in Newsletter #2 that they are looking for people who are willing to evaluate an "early access trial" version of their Visual Studio IDE for R, called RTVS (for R Tools for Visual Studio).

Based on the video, RTVS has the same four-window design as RStudio, so there's not an immediate struggle with an unfamiliar layout. David Smith's blog lists some of RTVS's current shortcomings, such as automated package support, that may or may not be a problem for you. I looked for signs that VS might facilitate the integration of R with other languages – such as C# for a front-end and R for the back-end – but not a whiff.

The greatest advantage of RTVS I can see is for IT shops that are comfortable

Mar 24, 2016

Control totals of a data.frame

When you are conducting a business analysis project with a data extract from the company's internal system, professional risk management suggests you make sure you are not missing any records or double counting any records. But you certainly don't want to look at every record. Yikes!

Auditors solve this predicament with control totals. When the sums of key fields and the numbers of records match known values, usually from some well-established "production report," it can be assumed your data "reconciles." *

What does it mean to calculate "control totals" of a general data.frame?

Mar 17, 2016

Google's New Search Algorithm Introduces Bias

Larry Magid has a technology "article" on the local radio station. I always turn up the volume when Magid comes on. Today's spot tells how Google Search going forward may be biased for you personally based on your Google-stored relationships. This might be handy sometimes. For example, when looking for a restaurant you may want results skewed toward your friends' favorites. Google calls these "private results." For other searches, "private results" could hide or demote the actual results you'd hoped to find. On his website Magid shows how to turn off the privatizing feature after each search, as well as how to remove it for all searches via your Google settings.

Magid mentions a third option: "Incognito" mode. In Incognito mode, it's as if you're not logged in to Google, in which case your bias-influencing relationships are (presumably!) not available. You can open a new Incognito window in Chrome via Ctrl-Shift-N. Here is the link to Google's instructions on how to browse Incognito-ly on various devices.

Mar 3, 2016

A horizontal scrolling code box in blogger

To display code in a blog I like to use a "code box" because I think it presents a more "professional" look. But it's not that easy with blogger.

By "code box" I mean a "window" with a monospaced font and vertical and horizontal scrolling bars as necessary. The internet search solutions I found almost worked, but not quite with blogger because the horizontal scroll bar wouldn't show up as expected. The vertical bar was there, but not the horizontal bar. Go figure.

But if you are comfortable hitting the HTML button next to Compose, that's easily fixed.

Feb 25, 2016

The making of a shiny mauc: chapter 2

This continues last week's post The making of a shiny mauc, based on Greg McNulty's mauc blog. It utilizes the RStudio interface to R, Desktop version.

Recall, the goal is to make an online shiny app that will run Greg's code using his data, all supplied in his post. Today we will address what modifications are necessary to show his first plot (below) on a web page. In a subsequent post we will see how to display all Greg's plots. After that we will see how

Feb 17, 2016

The making of a shiny mauc

When an excess of loss (XOL) reinsurance pricing actuary has only indemnity to work with, how can s/he reflect allocated loss adjustment expense (ALAE) in final cost projections? Such is the situation addressed by Greg McNulty in his blog Modeling ALAE Using Copulas (MAUC). According to McNulty, the classical approach — loading the indemnity value of each claim with an average ALAE/indemnity ratio — rests on "two very strong implicit assumptions": 1) ALAE and indemnity are "scaled copies" of each other and 2) ALAE and indemnity are "100% correlated." When those assumptions are questionable McNulty suggests an alternative approach.