In this post we investigate the conformance with actual data, similar to Ms. Silverstein's investigation of "all the values from Apple's financials for every quarter over the past ten years."
Four different types of financial documents from property/casualty insurance were investigated:
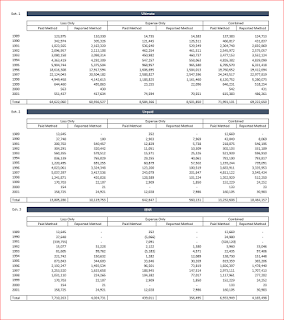
1. An exhibit of estimated ultimate loss using various actuarial methods, and related calculated values
 |
| Exhibits.pdf |
2. A Massachusetts insurance company rate filing
In addition to many financial values, rate filings include much text and many numbers that are non-financial in nature.
3. An insurance company annual statement from 2009
Annual statements (aka, the Yellow Book) include many, many, many, many, many, many financial values.
4. Schedule P data compiled by the Casualty Actuarial Society
Schedule P for six different lines of business for all U.S. property casualty insurers can be found at this link. The six files were combined into a single document. To isolate the investigation to purely financial numbers sans labels, company codes, and the like, the columns investigated are "IncurLoss_", "CumPaidLoss_", and "BulkLoss_".
Here are the results. The number of non-zero numbers in each document is indicated on the plot.
The Schedule P data is the most purely-financial in nature, and its plot in black matches Benford's Law almost exactly. Perhaps surprising, the Exhibits document is also quite close even though it holds the least number of observations. Perhaps a better job of pulling purely financial numbers out of the Rate Filing and the Annual Statement would improve their conformance.
Appendix
For reading PDF documents into R as text strings, I used the readPDF function in the tm package. Look at this link to learn how to download the binary files that make readPDF work easily, and the suggestion of where to store them for expediency.
To divide strings of characters into individual "words", I used 'scan' in base R. See this link.
For parsing numbers, in all their various forms with commas, decimal points, etc., I used the parse_number function in the readr package.
sessionInfo()
R version 3.3.1 (2016-06-21)
Platform: x86_64-w64-mingw32/x64 (64-bit)
Running under: Windows >= 8 x64 (build 9200)
locale:
[1] LC_COLLATE=English_United States.1252 LC_CTYPE=English_United States.1252
[3] LC_MONETARY=English_United States.1252 LC_NUMERIC=C
[5] LC_TIME=English_United States.1252
attached base packages:
[1] stats graphics grDevices utils datasets methods base
other attached packages:
[1] readr_1.0.0 tm_0.6-2 NLP_0.1-9
loaded via a namespace (and not attached):
[1] assertthat_0.1 rsconnect_0.4.3 parallel_3.3.1 tools_3.3.1 tibble_1.2
[6] Rcpp_0.12.5 slam_0.1-38

No comments:
Post a Comment